At a Glance
A position-time graph shows where an object is at every moment. Its slope gives velocity, v = Δx / Δt, so a steeper line means faster motion, a negative slope means motion back toward the origin, and a curved line means the object is accelerating.
- Vertical axis
- Position x, in meters (m)
- Horizontal axis
- Time t, in seconds (s)
- Slope means
- Velocity, v = Δx / Δt (m/s)
- Flat line
- Object at rest
- Curved line
- Velocity changing (acceleration)
- Also called
- Displacement-time or x-t graph
On this page
- What Is a Position-Time Graph?
- Position-Time Graphs Explained Simply
- Why Does the Slope Equal Velocity?
- What Do the Different Shapes Mean?
- What Does a Negative Slope Mean?
- How Do You Read a Curved Position-Time Graph?
- What Are Some Real-Life Examples?
- How Does It Connect to Other Motion Graphs?
- Practice Reading Position-Time Graphs
- Common Misconceptions
- Key Facts
- Quiz
- FAQ
What Is a Position-Time Graph?
A position-time graph is a picture of a motion. Time runs along the horizontal axis and position runs up the vertical axis, so every point on the line answers one question: where was the object at that moment? Reading across the whole line tells the full story of the trip.
Position is measured from a chosen reference point, called the origin, along a straight line. Values above zero are on one side of the origin and values below zero are on the other. That choice of origin and positive direction is part of setting up the frame of reference.
You may also see the same graph called a displacement-time graph or an x-t graph. A related chart, the distance-time graph, plots total distance instead, so it can never slope downward. A position-time graph can, which makes it more informative.
Position-Time Graphs Explained Simply
Think of the graph as a diary of where something was. Each second you write down how far the object is from a starting post, then you plot those numbers. Connect the dots and you have the graph.
If the line climbs, the object is moving away from the post. If the line stays level, the object is sitting still. If the line drops, the object is coming back. The steeper the climb or the drop, the faster it is moving.
That is really all there is to it. Everything else on this page is a more careful way of reading those three ideas.
Why Does the Slope Equal Velocity?
The slope of any line is rise over run. On a position-time graph, the rise is a change in position,
To find the slope, pick two points on the line that are far apart and easy to read. Subtract the earlier position from the later one, subtract the earlier time from the later one, and divide. Using points far apart reduces the effect of small reading errors.
For a straight line, the slope is the same everywhere, so the velocity is constant. That case is called uniform motion. The diagram below shows a trip in three straight stages, each with its own slope.
The slope between any two points on the graph is the average velocity over that interval.
| Symbol | Quantity | SI unit |
|---|---|---|
| average velocity | meter per second (m/s) | |
| displacement | meter (m) | |
| time interval | second (s) |
Rearranged to find another variable:
Valid for: velocity is a vector; Δx is displacement (sign gives direction), not distance.
Example 1 Slope of a dog walker's line
On a position-time graph, a dog walker's line rises steadily from x = 0 m at t = 0 s to x = 180 m at t = 150 s. What is the walker's velocity?
- Given:
- displacement:
- time interval:
- displacement:
- Formula:
- Substitute:
- Answer:
Rise over run gives the velocity directly, and a steady straight line means this value holds for the whole walk.

What Do the Different Shapes Mean?
Each shape of line corresponds to a particular kind of motion. Learning to recognize them quickly is the key skill for reading these graphs.
- Horizontal line: the position never changes, so the object is at rest.
- Straight line sloping up: constant velocity in the positive direction.
- Straight line sloping down: constant velocity in the negative direction.
- Steeper straight line: a larger speed than a gentler one.
- Curve getting steeper: the object is speeding up.
- Curve getting flatter: the object is slowing down.
The table after this section collects the same rules in one place. When two lines cross on the same graph, the two objects are at the same position at that time, which is how you find when one catches another.
| Line shape | Slope | Velocity | Motion |
|---|---|---|---|
| Horizontal | Zero | Zero | At rest |
| Straight, rising | Positive, constant | Constant, positive | Steady motion away from origin |
| Straight, falling | Negative, constant | Constant, negative | Steady motion back toward origin |
| Steeper straight line | Larger size | Larger speed | Faster steady motion |
| Curve getting steeper | Size increasing | Speed increasing | Speeding up |
| Curve getting flatter | Size decreasing | Speed decreasing | Slowing down |
| Two lines crossing | Any | Any | Objects at the same place at the same time |
| Source: Interpretation rules derived from v = Δx / Δt · Retrieved October 2026 | |||
What Does a Negative Slope Mean?
A line that slopes downward has a negative slope, which means a negative velocity. The object is moving in the direction we chose to call negative, usually back toward the origin or past it.
A negative velocity does not mean the object is slow or slowing down. A ball rolling back at 4 m/s has a velocity of minus 4 m/s but a speed of 4 m/s. The sign only carries direction, which is why velocity is a vector and speed is not.
Watch out for lines that cross the time axis. Crossing zero means the object passed through the origin; it does not mean it stopped. The object stops only where the line is momentarily flat.
Example 2 A toy car rolling back
A remote-control car's position falls from x = 12 m to x = 3 m between t = 4 s and t = 10 s. What is its velocity over that interval?
- Given:
- displacement:
- time interval:
- displacement:
- Formula:
- Substitute:
- Answer:
The minus sign is the graph's downward slope: the car is driving back toward the origin.
How Do You Read a Curved Position-Time Graph?
When velocity changes, the slope changes, and the line curves. A curve that bends upward, getting steeper with time, shows an object speeding up in the positive direction. A curve that flattens out shows an object slowing to a stop.
To find the velocity at one instant on a curve, draw a tangent line that just touches the curve at that point, then measure the tangent's slope. That gives the instantaneous velocity. The second diagram shows a tangent drawn on a car that speeds up and then cruises.
For constant acceleration starting from rest, the curve is half of a parabola, because position grows with the square of time. That link is one of the kinematic equations.
Example 3 Predicting where a skater will be
A skater's position-time line is straight with a slope of 3.2 m/s. How far does her position change during the next 25 s?
- Given:
- average velocity:
- time interval:
- average velocity:
- Formula:
- Substitute:
- Answer:
Extending a straight line forward is only safe when the velocity really stays constant.

What Are Some Real-Life Examples?
A school bus route makes a good example. The line climbs while the bus drives, goes flat at each stop, and climbs again. The flat segments show exactly how long each stop lasted.
An elevator ride up and down a building gives a line that rises, levels at a floor, then falls back. A sprinter leaving the blocks produces a curve that starts gently and steepens as she accelerates, then turns into a straight line once she reaches top speed.
GPS fitness apps build these graphs automatically from position readings. Looking at one after a run quickly shows where you paused and where you pushed hardest.
| Time (s) | Position (m) | Slope since previous reading (m/s) | What is happening |
|---|---|---|---|
| 0 | 0 | n/a | Start at the origin |
| 2 | 3 | 1.5 | Walking forward |
| 4 | 6 | 1.5 | Walking forward at the same pace |
| 6 | 6 | 0 | Standing still |
| 8 | 4 | -1 | Walking back |
| 10 | 2 | -1 | Still walking back |
| Source: Invented sample data; slopes computed with v = Δx / Δt · Retrieved October 2026 | |||

How Does It Connect to Other Motion Graphs?
The position-time graph is one of three related motion graphs. Take the slope of a position-time graph at every moment and plot those values, and you get the velocity-time graph. Take the slope of that, and you get the acceleration-time graph.
The process also works in reverse. The area under a velocity-time graph gives the change in position, which lets you rebuild the position-time graph from velocity data. Physicists move between the three graphs constantly, choosing whichever makes a problem easiest.
Practice Reading Position-Time Graphs
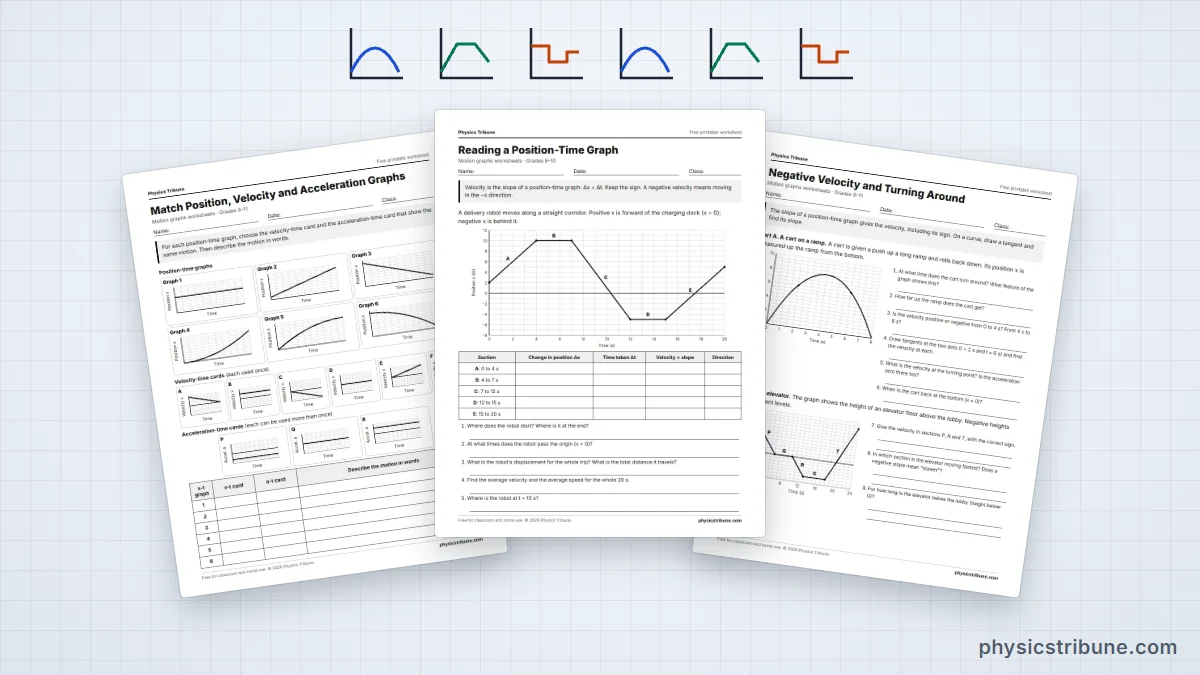
Graph reading improves fast with practice. Our motion graphs worksheets include sketching and slope questions with answer keys, and the distance-time graph worksheets cover the simpler cousin. For a refresher on why slope and velocity go together, see speed vs velocity.
The idea of describing motion with a graph traces back to the careful timing experiments of Galileo Galilei, who showed that a ball rolling down a ramp covers distances that grow with the square of time.
Common Misconceptions
Myth: The graph shows the path the object traveled, like a map.
Physics: The graph shows position against time, not a route on the ground. A line sloping upward does not mean the object is going uphill.
Myth: A higher point on the graph means a faster object.
Physics: Height shows position. Speed comes from the steepness of the line, so a high, flat line describes an object far away but at rest.
Myth: When the line crosses the time axis, the object stops.
Physics: Crossing the axis only means the object passes the origin. It stops where the line is flat, with zero slope.
Myth: A downward slope means the object is slowing down.
Physics: A downward straight line means steady motion in the negative direction. Slowing down shows up as a curve that is flattening out.
Key Facts
- A position-time graph plots position on the vertical axis against time on the horizontal axis.
- The slope of a position-time graph equals velocity, v = Δx / Δt.
- A horizontal line means the object is at rest, and a straight sloped line means constant velocity.
- A downward slope means negative velocity, motion in the negative direction.
- A curved line means the velocity is changing, so the object is accelerating.
- The slope of a tangent line at one point gives the instantaneous velocity there.
- Where two objects' lines cross, the objects are at the same position at the same time.
Quick Quiz: How Well Do You Know Position-Time Graphs?
5 questions. Tap an answer to check it.
What does the slope of a position-time graph give you?
Slope is Δx / Δt, which is the definition of velocity.
A line on a position-time graph is perfectly horizontal. What is the object doing?
Zero slope means zero velocity, so the object is not moving.
A position-time line goes from 20 m to 5 m over 5 s. What is the velocity?
Δx = 5 − 20 = −15 m, and −15 ÷ 5 = −3 m/s.
Which shape shows an object speeding up?
A slope that keeps growing means the velocity keeps growing.
How do you find instantaneous velocity on a curved position-time graph?
The tangent's slope is the velocity at that single instant.
Frequently Asked Questions
What does the slope of a position-time graph represent?
The slope represents velocity. Slope is the change in position divided by the change in time, which is exactly how velocity is defined. A steep slope means a large velocity, a gentle slope means a small one, a zero slope means the object is at rest, and a negative slope means the object is moving in the negative direction along the chosen axis.
What does a horizontal line on a position-time graph mean?
A horizontal line means the position is not changing, so the object is at rest during that time. The height of the line tells you where it is resting. For example, a flat line at 50 m means the object is sitting still 50 meters from the origin. The longer the flat segment, the longer the object stayed put.
How do you find velocity from a position-time graph?
Choose two points on a straight section of the line, preferably far apart. Subtract the earlier position from the later one to get the change in position, then subtract the earlier time from the later time. Divide the position change by the time change. The result, in meters per second, is the velocity over that section.
What does a curved line on a position-time graph mean?
A curved line means the velocity is changing, so the object is accelerating. If the curve gets steeper as time goes on, the object is speeding up. If it gets flatter, the object is slowing down. To find the velocity at one exact moment, draw a tangent line touching the curve at that point and measure its slope.
What is the difference between a position-time graph and a distance-time graph?
A distance-time graph plots the total distance traveled, which can only grow or stay the same, so its line never slopes downward. A position-time graph plots where the object is relative to an origin, so it can rise, fall or cross zero. That means a position-time graph shows direction, while a distance-time graph shows only how far.
Can a position-time graph have a negative slope?
Yes. A negative slope means the object has a negative velocity, so it is moving in the direction chosen as negative, often back toward the origin. The steeper the downward slope, the faster it is moving that way. A negative slope does not by itself mean the object is slowing down; it only tells you the direction.
What does it mean when two lines cross on a position-time graph?
When two objects are plotted on the same axes and their lines cross, both objects are at the same position at the same moment. That is how you find when and where one runner catches another or two cars pass each other. The crossing point does not say anything about their speeds, which come from the slopes of each line.
Is a position-time graph the same as a displacement-time graph?
In practice, yes. If you measure position from the starting point, then the position at any time equals the displacement from the start. Many textbooks use the two names interchangeably. The only difference appears when the origin is somewhere other than the starting point, in which case the whole line is shifted up or down but keeps the same slopes.