
At a Glance
A heating curve plots temperature against time for a substance heated at a constant rate. Sloped sections are single phases warming, where Q = m c ΔT, and flat plateaus are phase changes at the melting and boiling points, where Q = m L and the temperature does not change. A cooling curve is the mirror image, with plateaus at the condensation and freezing points.
- Axes
- Temperature (vertical) against time or heat added (horizontal)
- Sloped sections
- One phase warming or cooling: Q = mcΔT
- Flat plateaus
- Phase change at constant temperature: Q = mL
- Water's plateaus at 1 atm
- 0 °C (melting) and 100 °C (boiling)
- Longest plateau for water
- Boiling, about 6.8 times longer than melting
On this page
- What Is a Heating Curve?
- Heating Curves Explained Simply
- What Are the Five Stages of a Heating Curve?
- What Happens on the Sloped Parts of the Curve?
- Why Does the Temperature Stay Constant During a Plateau?
- How Do You Read the Slope of a Heating Curve?
- What Does a Cooling Curve Show?
- Where Do You See Heating and Cooling Curves in Real Life?
- How Do You Make a Heating or Cooling Curve in the Lab?
- Going Deeper: Curves for Mixtures and Other Pressures
- Practice Heating Curve Problems
- Common Misconceptions
- Key Facts
- Quiz
- FAQ
What Is a Heating Curve?
A heating curve records what a thermometer shows while a substance is heated at a steady rate. Time, or the total heat added, runs along the horizontal axis, and temperature runs up the vertical axis. The result is not a smooth line but a staircase of slopes and flat steps.
The classic example starts with ice below its freezing point and ends with steam above 100 °C. Along the way, water passes through all three common states of matter and two phase changes. Each part of the graph tells you what the molecules are doing at that moment.
Because the heat supply is steady, the horizontal axis doubles as an energy scale. A longer section means more energy was needed to get through that stage.
Heating Curves Explained Simply
When you heat something, the energy can do one of two jobs. It can make the molecules move faster, which raises the temperature. Or it can pull the molecules apart from each other, which changes the phase. It almost never does both at once.
On the graph, the first job looks like a ramp going up. The second job looks like a flat shelf. So a heating curve is really a record of which job the energy is doing at each moment.
Picture an ice cube in a pan on a low flame. It warms up to 0 °C, then sits at 0 °C while it melts, even though the flame is still on. Only after the last bit of ice is gone does the water start warming again.
What Are the Five Stages of a Heating Curve?
A full heating curve for water at normal air pressure has five stages:
- Solid warming. Ice warms from its starting temperature up to 0 °C. The line slopes upward.
- Melting. Ice and water coexist at 0 °C. The line is flat while the ice absorbs the latent heat of fusion.
- Liquid warming. Water warms from 0 °C to 100 °C. The line slopes upward again, more gently than for ice.
- Boiling. Water and steam coexist at 100 °C. The line is flat, and this plateau is by far the longest.
- Gas warming. Steam warms above 100 °C, as long as it is kept in a container so it cannot escape.
Other substances follow the same five steps. Only the temperatures of the plateaus, the steepness of the slopes and the lengths of the steps change.
| Stage | Formula | Heat (kJ) | Time at 1,000 W | Share of total | Slope (K/s) |
|---|---|---|---|---|---|
| Ice warms from −15 °C to 0 °C | Q = mcΔT, c ≈ 2,100 J/(kg·K) | 15.75 | about 16 s | 1.0% | 0.95 |
| Ice melts at 0 °C | Q = mLf | 167.0 | 167 s (2.8 min) | 11.0% | 0 (plateau) |
| Water warms from 0 °C to 100 °C | Q = mcΔT, c = 4,186 J/(kg·K) | 209.3 | about 209 s (3.5 min) | 13.8% | 0.48 |
| Water boils at 100 °C | Q = mLv | 1,128.0 | 1,128 s (18.8 min) | 74.2% | 0 (plateau) |
| Total | 1,520.05 | about 1,520 s (25.3 min) | 100% | ||
| Source: Computed with Q = mcΔT and Q = mL; specific heat of ice is a typical value; assumes no heat lost to the room · Retrieved October 2026 | |||||

What Happens on the Sloped Parts of the Curve?
On a sloped part, only one phase is present and all the added heat goes into faster molecular motion. The temperature therefore rises, and the amount of heat needed follows
Each phase has its own specific heat, so each sloped part uses a different value of c. For water, the liquid needs about 4,186 J to warm one kilogram by one kelvin, while ice and steam need roughly half as much. That is why the liquid section of the curve looks gentler than the ice and steam sections. To check your own numbers, try our specific heat calculator.
On every sloped part of the curve, the heat added and the temperature rise are linked by this formula.
| Symbol | Quantity | SI unit |
|---|---|---|
| heat transferred | joule (J) | |
| mass | kilogram (kg) | |
| specific heat capacity (water ≈ 4186 J/(kg·K)) | joule per kilogram kelvin (J/(kg·K)) | |
| temperature change | kelvin (K) |
Rearranged to find another variable:
Valid for: no phase change in the temperature range.
Example 1 Warming ice from the freezer
A 0.5 kg block of ice comes out of a freezer at −15 °C and is heated to its melting point of 0 °C, a rise of 15 K. Using a typical specific heat for ice of 2,100 J/(kg·K), how much heat does this first sloped stage need?
- Given:
- mass:
- specific heat capacity (water ≈ 4186 J/(kg·K)):
- temperature change:
- mass:
- Formula:
- Substitute:
- Answer:
This first ramp is short. A 1,000 W heater would finish it in about 16 seconds, if all its heat reached the ice.
Why Does the Temperature Stay Constant During a Plateau?
During a plateau, two phases are present together, and the added energy goes into loosening the bonds that hold molecules in place. The molecules do not speed up on average, so the temperature does not rise. This hidden energy is the latent heat, and the amount needed is
The melting plateau uses the latent heat of fusion, 334,000 J/kg for water. The boiling plateau uses the latent heat of vaporization, 2,256,000 J/kg. Boiling needs about 6.8 times more energy than melting, because turning a liquid into a gas pulls molecules almost completely apart, while melting only lets them slide past one another.
A plateau ends only when the last of the old phase is gone. Turning up the heat makes the plateau shorter in time, but it does not raise the temperature of a pot of boiling water at the same pressure. Our latent heat calculator finds the energy for any plateau.
Example 3 Energy for the boiling plateau
The same 0.5 kg of water reaches 100 °C and starts to boil. The latent heat of vaporization of water is 2,256,000 J/kg. How much heat must be added before every drop has turned to steam?
- Given:
- mass changing phase:
- latent heat of fusion (L_f) or vaporization (L_v):
- mass changing phase:
- Formula:
- Substitute:
- Answer:
At 1,000 W this plateau lasts about 1,128 s, close to 19 minutes (computed), while the thermometer stays at 100 °C the whole time.
How Do You Read the Slope of a Heating Curve?
The steepness of a sloped part tells you how quickly the temperature climbs. With a heater of power P, the rate of rise is
This gives you a way to compare phases at a glance. If two sloped parts of the same curve differ in steepness, the flatter one belongs to the phase with the larger specific heat. For water, that is the liquid section.
The length of a plateau tells you the latent heat in the same way. Divide the plateau's duration by the heater power and you get the energy, so a plateau twice as long means twice the latent heat.
Example 2 How fast does the water section climb?
A 1,000 W immersion heater warms 0.5 kg of liquid water for 60 s, with all of its heat going into the water. Taking c = 4,186 J/(kg·K), by how much does the water's temperature rise during that minute?
- Given:
- P:
- t:
- mass:
- specific heat capacity (water ≈ 4186 J/(kg·K)):
- P:
- Formula:
- Substitute:
- Answer:
Ice and steam have about half the specific heat of water, so the same heater makes their sections of the curve climb roughly twice as steeply.
What Does a Cooling Curve Show?
A cooling curve is a heating curve run backward. A hot substance loses heat to its surroundings, its temperature falls along sloped sections, and it pauses on flat plateaus while it condenses and then freezes. On those plateaus the substance releases the same latent heat it absorbed while boiling and melting.
Real cooling curves rarely have perfectly straight slopes. A hot object cools fastest when it is much warmer than the room and more slowly as it approaches room temperature, so the curve bends and levels off. The graph below shows this for a mug of tea, which has no phase change on the way down.
Many liquids also show supercooling: the temperature dips a little below the freezing point before the first crystals form. Once freezing starts, the latent heat released pushes the temperature back up to the freezing point, where it stays for the rest of the plateau.

Where Do You See Heating and Cooling Curves in Real Life?
Heating and cooling curves explain a lot of everyday experiences:
- Ice in a drink keeps the drink near 0 °C until the last cube melts, because melting soaks up heat at a fixed temperature.
- Boiling pasta water stays at about 100 °C no matter how high the flame is set, so a higher flame only boils the water away faster.
- Steam burns are worse than burns from water at the same temperature, because steam releases its large latent heat as it condenses on skin.
- Farmers spraying orchards before a frost rely on freezing water releasing latent heat, which keeps buds near 0 °C.
- Chocolate makers follow careful heating and cooling curves so the cocoa butter sets in a glossy crystal form.
For a side-by-side look at the two quantities on the graph, read heat vs temperature.

How Do You Make a Heating or Cooling Curve in the Lab?
A common classroom method is to melt a solid with a low melting point in a test tube placed in a hot water bath, then let it cool while recording the temperature every 30 seconds. A digital probe gives the cleanest data. When the results are plotted, the freezing plateau stands out clearly.
To get a good curve, keep the heating rate steady, stir gently so the temperature is even, and keep the probe away from the glass. Heat leaks to the room make real curves a little rounded at the corners, which is normal.
Always use eye protection, keep hot water away from the edge of the bench, and let an adult handle any open flame or boiling water.
Going Deeper: Curves for Mixtures and Other Pressures
Pure substances give sharp, flat plateaus. Mixtures such as salt water, candle wax or most alloys melt over a range of temperatures instead, so their plateaus tilt and blur. This is one quick way to test whether a sample is pure.
Pressure also moves the plateaus. At lower air pressure the boiling plateau sits lower, which is why water boils at a lower temperature at altitude. A full map of plateau temperatures at every pressure is exactly what a phase diagram shows.
Practice Heating Curve Problems
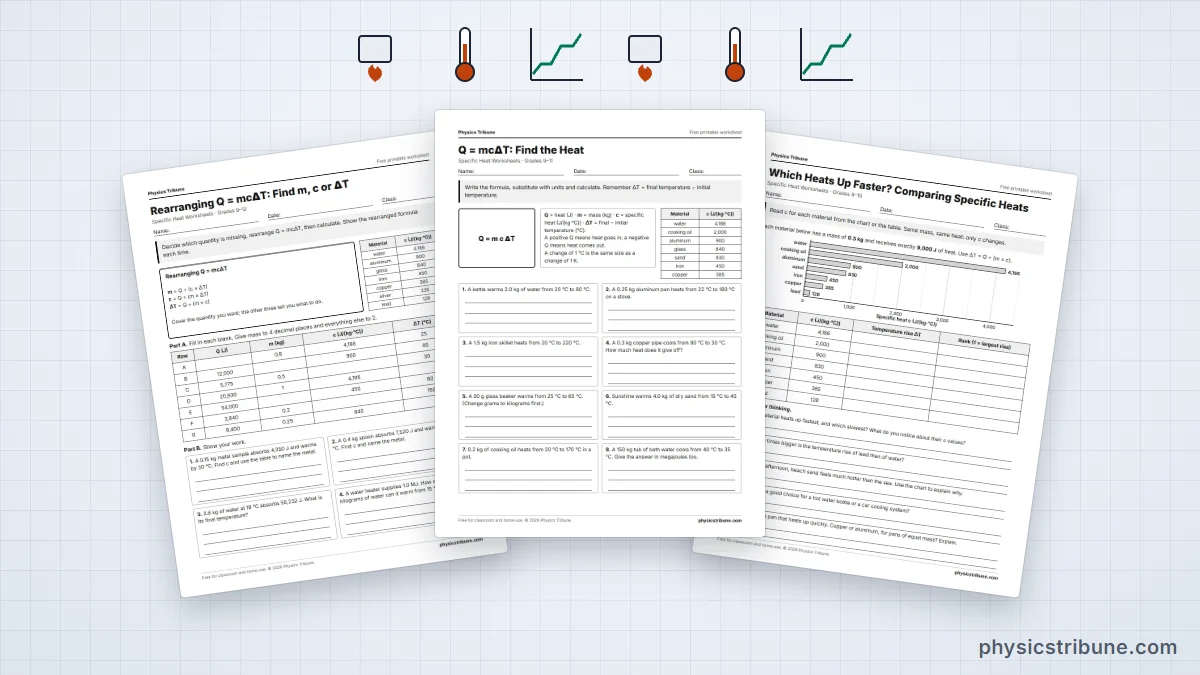
Try sketching the heating curve for 1 kg of ice at −10 °C heated by a 500 W heater, labeling each stage and its duration. Our specific heat worksheets include printable heating curve questions with answer keys. Then check yourself with the quiz below.
Common Misconceptions
Myth: If you keep heating boiling water, its temperature keeps rising.
Physics: At a fixed pressure, boiling water stays at its boiling point. Extra heat only turns the water into steam faster.
Myth: During a plateau no heat is being added.
Physics: Heat is still flowing in at the same rate. It goes into separating molecules instead of speeding them up, so the temperature does not change.
Myth: The melting and boiling plateaus are about the same length.
Physics: For water, boiling needs about 6.8 times as much energy as melting, so the boiling plateau is much longer at the same heating rate.
Myth: Every sloped section of a heating curve has the same steepness.
Physics: Each phase has its own specific heat. Liquid water warms more slowly than ice or steam because its specific heat is about twice as large.
Key Facts
- A heating curve plots temperature against time or heat added for a substance heated at a steady rate.
- Sloped sections show one phase warming, and the heat needed is Q = mcΔT.
- Flat plateaus show a phase change, where the heat needed is Q = mL and the temperature stays constant.
- For water at 1 atm the plateaus are at 0 °C for melting and 100 °C for boiling.
- The boiling plateau of water is about 6.8 times longer than the melting plateau because the latent heat of vaporization is much larger.
- A steeper slope means a smaller specific heat or a smaller mass.
- A cooling curve is the reverse journey, and its plateaus release the same latent heat that heating absorbed.
Quick Quiz: How Well Do You Know Heating and Cooling Curves?
6 questions. Tap an answer to check it.
What is happening on a flat plateau of a heating curve?
Plateaus are phase changes, where the energy breaks bonds instead of raising the temperature.
Which formula gives the heat needed on a sloped section?
Sloped sections are single phases warming, so the heat is mass times specific heat times temperature change.
On water's heating curve at 1 atm, at what temperature is the longest plateau?
The boiling plateau at 100 °C needs about 6.8 times more energy than the melting plateau.
Why is the liquid water section less steep than the ice section?
A larger specific heat means each joule raises the temperature less, so the slope is gentler.
On a cooling curve, what does the freezing plateau do?
Freezing releases the same latent heat that melting absorbs, which holds the temperature steady.
Turning up the burner under a pot of boiling water at sea level will...
More heat shortens the plateau in time, but the temperature stays at the boiling point.
Frequently Asked Questions
What is a heating curve?
A heating curve is a graph of temperature against time or heat added while a substance is heated at a steady rate. It shows sloped parts, where one phase warms up, and flat plateaus, where the substance changes phase at a constant temperature. For water, the plateaus appear at 0 °C for melting and at 100 °C for boiling at normal air pressure.
Why are there flat lines on a heating curve?
The flat lines are phase changes. While a solid melts or a liquid boils, the added energy goes into breaking the bonds between molecules rather than making them move faster. Since temperature measures average molecular motion, it stays the same until the phase change is complete. This energy is called latent heat and is found with Q = mL.
What is the difference between a heating curve and a cooling curve?
A heating curve shows a substance absorbing heat, with its temperature rising and pausing at the melting and boiling points. A cooling curve shows it losing heat, with its temperature falling and pausing at the condensation and freezing points. The plateau temperatures are the same for a pure substance, but on a cooling curve the substance releases its latent heat.
Which plateau on the heating curve of water is longest?
The boiling plateau at 100 °C is the longest. Water's latent heat of vaporization is 2,256,000 J/kg, compared with 334,000 J/kg for melting, so boiling needs about 6.8 times as much energy. At a steady heating rate, that makes the boiling plateau about 6.8 times longer than the melting plateau.
What does the slope of a heating curve tell you?
The slope shows how fast the temperature rises, which depends on the heating power, the mass and the specific heat of that phase. A steep slope means a small specific heat or a small mass. On water's curve, the liquid section is gentler than the ice and steam sections because liquid water has the largest specific heat of the three phases.
Is kinetic or potential energy changing during a plateau?
During a plateau, the average kinetic energy of the molecules stays the same, which is why the temperature is constant. The added energy goes into the potential energy of the molecules as they move farther apart and break free of their neighbors. On the sloped sections the opposite happens: the energy mainly raises the molecules' kinetic energy.
What is supercooling on a cooling curve?
Supercooling is when a liquid cools below its freezing point without turning solid, because crystals have not yet started to form. On a cooling curve it shows up as a small dip just before the freezing plateau. As soon as crystals appear, the latent heat they release warms the liquid back up to the freezing point, and the plateau continues normally.
How do you calculate the total heat on a heating curve?
Split the curve into its stages and add them up. Use Q = mcΔT for each sloped stage, with the specific heat of that phase, and Q = mL for each plateau, with the right latent heat. For example, heating 0.5 kg of ice at −15 °C all the way to steam at 100 °C takes about 1,520 kJ in total.
Keep Exploring



Sources
Constants come from NIST CODATA 2022 (public domain) and unit definitions from the BIPM SI Brochure (CC BY 4.0). Text, diagrams and illustrations are original work by Physics Tribune.